
Rail Monitoring Logic Application Design
Wayside monitoring logic is not a small cousin of the interlocking. It runs on its own hardware, on its own power, behind isolated inputs — and it has an entirely different job: observe everything, decide what matters, record it at the right cadence, and survive being deployed to hundreds of sites that are all wired slightly differently. That last constraint is what shapes the design. This guide sets out what a well-built monitoring logic application actually contains, from per-sensor POUs and external configuration through to alarm delays, logging streams, maintenance mode, and the operational statistics the logger derives at the edge.
Two systems, deliberately kept apart
Before any discussion of what the monitoring logic does, it is worth being precise about where it runs — because the architecture is the reason the software can be written the way it is.
The vital logic — the interlocking, the level crossing controller, anything whose failure could produce an unsafe condition — runs on dedicated, purpose-designed safety hardware, typically certified to SIL 4 under the CENELEC framework and developed under the software lifecycle of EN 50716 (which supersedes EN 50128). That hardware is expensive, change-controlled, and slow to modify for very good reasons.
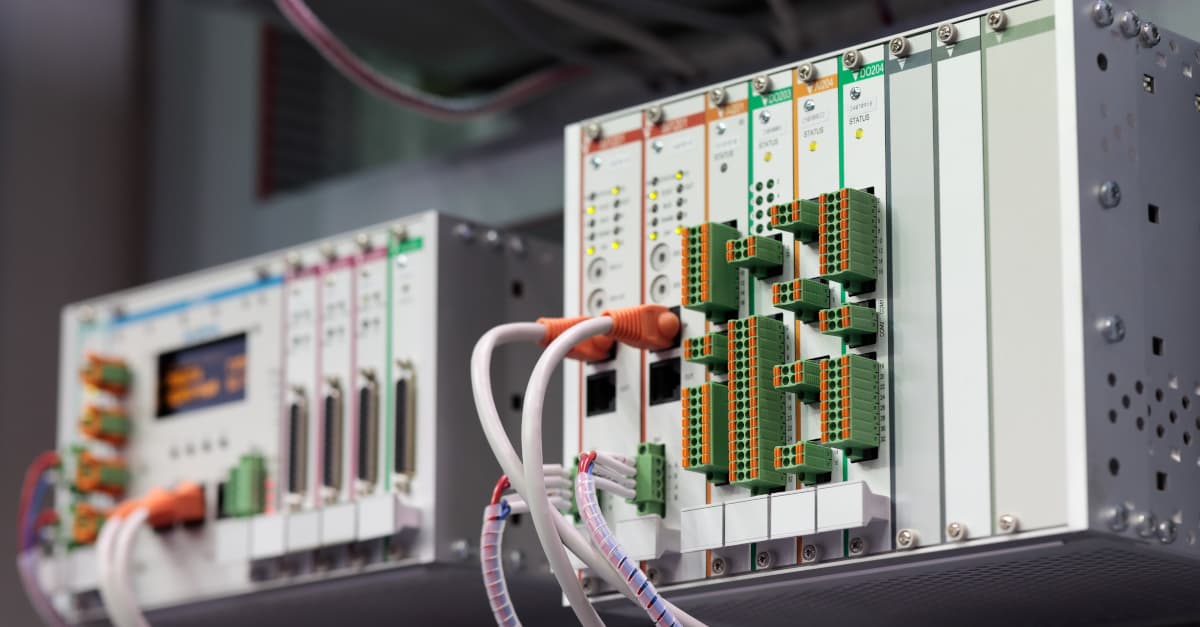
The monitoring logic runs somewhere else entirely: on a separate, standard industrial PLC or data logger. The separation is not a naming convention inside a shared controller — it is physical, and it is enforced at three levels:
- Separate hardware. The monitoring PLC is its own device. Nothing it does — a crashed task, a full disk, a firmware update — can reach into the vital processor.
- Independent power supply. The logger is fed from its own supply, so an inrush, a short, or a failure in the monitoring system cannot disturb the signalling supply. It also means the monitoring system can be worked on, isolated, or replaced without touching the power feeding vital equipment.
- Electrically isolated inputs. Every signal the logger takes from the signalling world crosses an isolation barrier — opto-isolators on digital inputs, isolation amplifiers or clamp-on current transformers on analog. Sensing is high-impedance, so the act of monitoring does not load or alter the circuit being monitored, and a fault on the logger side cannot propagate back into a vital circuit.
The consequence for the software is liberating. Because the monitoring application is architecturally incapable of influencing a safety function, it can be developed and updated at the pace the operations business actually needs — new alarms, new derived measurements, new logging — without reopening a safety case. The discipline it must keep in exchange is absolute: it reads, and it never writes. There is no output from the monitoring logic into a vital circuit, and no path by which one could be added by accident.
IEC 61131-3, briefly
Monitoring logic is almost always written in IEC 61131-3, the international standard that defines how programmable controllers are programmed. It specifies five languages — Ladder Diagram, Function Block Diagram, Structured Text, Sequential Function Chart, and the deprecated Instruction List — plus common data types and the program organisation units (POUs): functions, function blocks, and programs.
Two things about it matter here. First, structured text is the natural language for this work:
monitoring is dominated by arithmetic, thresholds, timers, state machines, and file handling,
all of which are clumsy in the graphical languages. Second, the controller executes a
deterministic scan cycle — read all inputs into a process image, run the
program once top to bottom, write outputs, repeat. Everything below is shaped by that: inputs
are sampled once per scan so edge detection must be explicit against the previous scan, timing
uses the standard TON/TOF blocks, and every path must complete inside
the scan budget. The standard is vendor-neutral, which is what allows the same application to be
built for more than one controller family — a point worth holding onto when you read the
configuration section below.
One application, every site
Here is the constraint that dominates the design. A rail operator does not have one level crossing; it has hundreds. They are not identical. Some are predictor-controlled, some use discrete approach track circuits. Some have booms, some are flashing-light only. Some have four lamp circuits, some have twelve. And critically, they are not wired the same way — the input that carries "crossing active" at one site is a different physical terminal at the next.
The naive response is a per-site software fork: copy the application, adjust it, compile, deploy. This fails at scale in an entirely predictable way. Every site becomes its own artefact with its own version. A bug fixed centrally has to be re-applied by hand hundreds of times. Nobody can say with confidence what logic is running at any given location. The fleet drifts.
The pattern that works is to make the application identical everywhere and driven entirely by external configuration. The compiled logic is one verified artefact. What changes per site is a set of configuration files that the application reads at startup — and, if the design supports it, re-reads on demand without a restart. Typically these split into two:
- A parameters file — thresholds, alarm delays, logging intervals, deadbands, site identity, timing limits. The numbers.
- A functions file — which monitored function is assigned to which physical input position. The wiring map.
Assignable function positions
The functions file is the part people underestimate. Because no two crossings are wired
identically, the logic must not assume that digital input 3 is always "east boom down". Instead
each function — a named, meaningful thing like BOOM_DOWN_EAST,
LAMP_CCT_1, PREDICTOR_ACTIVE, DOOR_OPEN — is
assigned to an input position in configuration. The application resolves the
mapping at startup and works in terms of functions thereafter.
This decouples the logic from the loom entirely. A site with an unusual wiring arrangement needs a different configuration file, not different code. Commissioning becomes a configuration exercise a field engineer can do, and re-terminating an input after a cable fault is a configuration edit rather than a software change request.
Alarms that enable themselves
The functions map does more than resolve I/O. It tells the application what exists at this site, and the alarm logic keys off that directly: if a function has no input assigned, the alarms belonging to it are not evaluated at all.
The clearest example is crossing control type. A site controlled by a grade crossing predictor does not have discrete approach and departure track sections, so up and down track sequence checking simply does not apply — there is no sequence of section occupancies to verify. That site's configuration assigns predictor functions instead, and the logic enables the predictor-related alarms and leaves the track-sequence ones dormant. At a track-circuit-controlled site the reverse happens.
Getting this right avoids the two failure modes that destroy trust in a monitoring system faster than anything else: permanently standing alarms for equipment that was never installed, which train operators to ignore the alarm list; and silently missing alarms for equipment that is installed but was never configured, which means the system is quietly not watching something everyone assumes it is.
Tip: Make the application report its own configuration state upward — the list of functions it resolved, which alarms it therefore enabled, and which inputs it found unassigned. A site that believes it is monitoring six lamp circuits when the design called for eight should be visible from the operations console on day one, not discovered during an investigation two years later.
Versioning and configuration integrity
Once one application serves the whole fleet, two questions become operationally critical: what logic is running here, and has its configuration changed?
The first is answered by versioning the logic application itself — a version identifier compiled into the application, exposed as a readable value and reported to the central platform with every connection. Fleet-wide, that turns "what is running out there?" into a query rather than a site visit.
The second is answered by a CRC check over the configuration files. At load time the application computes a CRC across each file and compares it against the expected value; a mismatch means the configuration was corrupted in transfer or storage, and the logic can refuse to run on a file it cannot verify rather than operate on unknown parameters. Reporting the computed CRC upward alongside the logic version means an unexpected configuration change at any site becomes visible centrally — someone edited a threshold on the device, and the fingerprint no longer matches what the platform believes is deployed.
One honest caveat, because rail engineers will and should ask: a CRC is an integrity check, not a cryptographic signature. It reliably detects accidental corruption and casual, undocumented edits. It does not prove who made a change and it can be recomputed by anyone who can write the file. Where the threat model includes deliberate tampering, the CRC is the first layer and signed configuration with per-device identity is the one that actually carries the argument.
A POU per sensor type
The internal structure that makes all of this maintainable is modularity by sensor type: one POU per sensor type, each encapsulating everything about monitoring that class of equipment — its inputs, its thresholds, its state machine, its alarm conditions, its derived values.
A monitoring application typically ends up with a block for each of the asset families it watches — lamp circuits, track circuits or predictors, booms and barriers, point machines, batteries and chargers, door and environmental sensors — each written once, verified once, then instantiated per device from configuration. Six lamp circuits at a site are six instances of the same block with six sets of parameters.
The benefits compound in exactly the places that hurt otherwise:
- Verification is bounded. Reviewing the lamp-monitoring logic means reviewing one block, not sixty copies that have drifted.
- Alarm behaviour is consistent. Every instance debounces, delays, raises and clears identically, so the operator sees one coherent behaviour across the fleet.
- Extension is additive. A new sensor type is a new POU and a new configuration section — it does not disturb what already works.
- The interface is the specification. The block's inputs and outputs document what the logic needs and what it produces, which is what a reviewer, an integrator and a future maintainer each need.
Threshold monitoring and alarm delays
Analog monitoring is where most of the diagnostic value lives — lamp current, battery voltage, point machine drive current, track circuit levels — and it is also where naive implementations generate the most noise. Three mechanisms do the heavy lifting.
Thresholds with hysteresis
Each monitored analog has configurable limits — typically a warning and an alarm level, high and low. A raw comparison against a single setpoint chatters whenever the value sits on the threshold, so the comparison carries hysteresis: the value must fall back past a separate reset level before the condition clears. Thresholds live in the parameters file because the correct value is a property of the site and the equipment, not of the code.
Learned baselines
For many assets a fixed threshold is a blunt instrument — what matters is deviation from how this device normally behaves. A learning mode captures healthy behaviour over an initial period and derives the baseline from it, as described for point machine drive-current signatures and lamp circuit current. The application must therefore track and expose a learning state per instance — not yet learning, learning in progress, learned — because a site that has not finished learning is a site that is not yet fully monitored, and that fact needs to be visible.
Configurable alarm delays
Every alarm carries a configurable on-delay: the condition must persist for a set period before the alarm is raised. Most also carry an off-delay before clearing. This is what separates a real fault from contact bounce, electrical noise, an inrush transient, or a value momentarily crossing a limit during normal operation.
The delays must be configurable per alarm and per site because the right value depends on local conditions — traffic density, cable run lengths, equipment type, how a particular make of relay behaves. A delay short enough to catch a genuine intermittent at one site is a noise generator at another. Fixing these at compile time guarantees that some sites are wrong, and it is the single most common root cause of the alarm floods covered in the guide on alarm flood reduction.
Three logging streams, three cadences
Logging is not one problem. Digital states, analog values and alarms have genuinely different capture rules, and conflating them into a single log produces a file that is simultaneously too large and missing what you need. A well-built application writes separate log files for each.
| Stream | Capture rule | Why |
|---|---|---|
| Digital | On change of state, timestamped | A steady state carries no new information. Writing only transitions gives a precise event record and no wasted volume — the basis of sequence-of-events analysis. |
| Analog | On a configurable interval, often with a deadband | A continuously varying value has no natural change event, so it is sampled on a timebase. A deadband captures significant excursions between samples without logging noise. |
| Alarm | On raise and on clear, with cause and state | Alarms are the operational record — what was wrong, when, for how long. Kept separate so they can be retained longer and consumed independently of raw data. |
The practical consequences of separating them are worth spelling out. Retention can differ per stream, so high-volume analog data ages out while the alarm history is kept for years. Transfer can be prioritised, so alarms reach the platform first when bandwidth is constrained. And each stream can be consumed by the system that needs it without parsing the others.
Maintenance mode: the door input
A technician working in a location case will disconnect wiring, operate equipment by hand, and generate conditions indistinguishable from genuine faults. Without handling, every maintenance visit produces an alarm storm, and worse, it pollutes the trend data that condition monitoring depends on.
The fix is a cabinet door input wired as a monitored function. When the door opens, the application enters a maintenance state and:
- Suppresses or flags alarms rather than escalating them, so the control room is not flooded by planned work.
- Tags the recorded data as maintenance activity, so it can be excluded from baselines, trends and performance statistics rather than corrupting them.
- Logs entry and exit as events, giving an accurate record of who was on site and when — useful for correlating a change in behaviour with a visit.
- Alarms on unexpected opening. A door opening outside a planned work window is a security and tamper indication in its own right.
The design detail that matters is what happens on exit. Alarms should resume automatically when the door closes, with a settling period before conditions are re-evaluated, so a technician who forgets to clear a mode flag does not leave a site silently unmonitored. Suppression should never depend on someone remembering to turn it off.
Local indication: driving the controller LEDs
A technician standing at an open cabinet, often with no laptop and marginal mobile coverage, should be able to read the state of the monitoring system from the front of the unit. Most industrial controllers expose user-controllable LEDs, and the logic application should drive them deliberately:
- Alarm active — at least one alarm is currently raised at this site.
- Learning incomplete — one or more instances have not finished establishing a baseline, so the site is not yet fully monitored.
- Configuration or CRC fault — the application could not verify or resolve its configuration.
- Communications state — whether the logger is currently reaching the central platform.
It is a small feature that pays for itself on the first site visit. It also closes a surprisingly common gap: a technician who has just finished commissioning can confirm the monitoring is actually working before they drive away, instead of finding out days later that a site has been reporting nothing.
Operational statistics, not just faults
A monitoring application that only reports faults is doing half its job. The same inputs support a set of derived operational measurements that are often more valuable to the business than the alarms, and which should be computed at the edge so the record survives a loss of communications:
| Measurement | What it tells you |
|---|---|
| Train counts and direction | Actual traffic at the site — the denominator for every per-operation statistic and a sanity check against timetabled movements |
| Warning time per activation | Time from crossing activation to train arrival, measured against the jurisdictional minimum. Directly evidences regulatory compliance |
| Flashing time | Total duration the lights flashed per activation. Excessive flashing time means unnecessary road delay; short means investigate |
| Activation and deactivation times | How long the crossing took to start and to release — a direct measure of controller and detection health |
| Boom descent and rise times | Mechanical condition trend for the barrier drive, well before it fails |
| Per-asset operation counts | Duty cycle for maintenance planning — which assets are working hardest, and which are due |
These turn the logger from a fault reporter into a source of evidence: for regulatory reporting, for maintenance scheduling, and for answering the question that follows every incident — what exactly did this crossing do, and when?
Remote management
Wayside sites are expensive to visit. The logic should therefore support the routine interventions that would otherwise be a truck roll:
- Remote reboot. A controlled restart of the monitoring controller, commanded from the platform, logged with its reason and confirmed on return. Safe precisely because of the architecture at the top of this guide — the monitoring system is separate hardware, so restarting it cannot affect the vital equipment or the crossing's operation.
- Remote configuration update. Push a new parameters or functions file, verify its CRC before it is adopted, and fall back to the last known-good configuration if verification fails.
- Version and health reporting. Logic version, configuration CRC, learning state, uptime and last-error reported on connection, so fleet state is a dashboard rather than an investigation.
All of this is the wayside end of the practice covered in centralised firmware and configuration management: staged rollout, integrity verification, and the ability to prove what is actually running on each device.
The design in one table
The features above are not a wish list; each one exists because of a specific failure it prevents.
| Feature | Prevents |
|---|---|
| Separate hardware, supply and isolated inputs | Any possibility of monitoring affecting a vital function |
| One application, external configuration files | Per-site software forks and unmanageable fleet drift |
| Functions assignable to input positions | Code changes every time a site is wired differently |
| Alarms enabled from configured functions | Standing alarms for absent equipment; silent gaps for present equipment |
| Logic version + configuration CRC reported | Not knowing what is running, or that a config was altered |
| One POU per sensor type | Copy-paste drift and inconsistent alarm behaviour |
| Configurable alarm delays and hysteresis | Alarm chatter that buries genuine faults |
| Separate digital / analog / alarm logs | One oversized log that is still missing what you need |
| Door-driven maintenance mode | Alarm floods during planned work and corrupted trend baselines |
| Controller LED indication | Leaving site without knowing the monitoring works |
| Edge-derived statistics | Losing operational evidence when comms drop |
| Remote reboot and config update | Truck rolls for routine interventions |
Why it matters
Monitoring logic is judged over years, across a fleet, by people who did not write it. The designs that survive that are the ones where the code is one verified artefact and the variation lives in configuration; where each sensor type is a single reviewed block; where the system says out loud what it is monitoring, what version it is, and whether it has finished learning; and where alarms are quiet enough to be believed.
None of it is exotic. It is the difference between a monitoring system that becomes the trusted first place an engineer looks when something goes wrong, and one that quietly becomes an alarm list nobody opens.
Frequently asked questions
What is a rail monitoring logic application?
The non-vital application running on the wayside data logger or monitoring PLC at a site. It samples isolated inputs from signalling equipment, evaluates thresholds and sequences, raises and clears alarms, records digital, analog and alarm data to local logs, derives operational measurements such as warning time and train counts, and reports upward to a central platform. It observes the signalling system; it never controls it.
Does monitoring logic run on the same hardware as vital logic?
No. Vital logic runs on dedicated, purpose-designed safety hardware certified to a high safety integrity level, commonly SIL 4. Monitoring runs on a separate standard industrial PLC or data logger, usually with its own independent power supply, and every input it takes from signalling equipment is electrically isolated — so a fault in the monitoring system cannot propagate into a vital circuit.
How can one logic application serve many different sites?
By moving everything site-specific into external configuration files read at startup. One file holds parameters — thresholds, alarm delays, logging intervals. Another holds the functions map: which monitored function is wired to which physical input position, because no two crossings are wired identically. The compiled logic is the same everywhere; only the configuration changes.
Why run a CRC check on the configuration file?
A CRC computed at load time and compared against the expected value detects corruption in transfer or storage and reveals casual edits made on the device. Reported upward with the logic version, it makes unexpected configuration changes visible centrally. Note that a CRC is an integrity check, not a cryptographic signature — deliberate tampering needs signed configuration and per-device identity on top.
Why log digital, analog and alarm data separately?
Because their capture rules differ. Digitals are logged on change of state, so a steady state writes nothing and the record is a precise event list. Analogs are logged on a configurable interval, often with a deadband, because a continuously varying value has no natural change event. Alarms are logged as raise and clear events with cause. Separating them keeps each at its natural cadence and lets retention and transfer priority differ.
What are configurable alarm delays and why do they matter?
A period a condition must persist before the alarm raises, and usually a separate period it must be clear before it resets. Without them, contact bounce, noise or a value sitting on a threshold produces chatter that buries real faults. They must be configurable per site and per alarm because the right value depends on traffic density, cable runs and equipment type — it cannot be fixed sensibly at compile time.
Why does the logic monitor the cabinet door?
A technician working inside will disconnect wiring and operate equipment manually, generating conditions that look exactly like faults. A door-open input puts the logic into a maintenance state: alarms are suppressed or flagged, and data is tagged as maintenance activity so it does not corrupt trends and baselines. An unexpected door opening is itself worth alarming on.
How are alarms enabled or disabled per site?
Dynamically, from the functions configuration — if a function has no input assigned, its alarms are not evaluated. A predictor-controlled crossing has no discrete approach and departure sections, so up and down track sequence checking is disabled there while the predictor alarms are enabled. This avoids both standing alarms for absent equipment and silent gaps for equipment that is present but unconfigured.
What operational statistics should the logic derive?
Train counts and direction, activation and deactivation times, warning time per activation against the jurisdictional minimum, total flashing time, boom descent and rise times, and per-asset operation counts. Derived at the edge so the record survives a comms outage, they turn the logger into a source of compliance evidence and maintenance planning data rather than just a fault reporter.
What should monitoring logic look like?
RailNet Operations is being shaped around ideas like these — one configurable IEC 61131-3 application per fleet rather than per site, a POU for each sensor type, functions mapped to input positions in configuration, versioned logic with CRC-checked config, separate logging streams, and edge-derived crossing statistics. All of it on separate hardware from the vital system, reading from the signalling world without ever writing to it. If you write, review or maintain wayside monitoring logic, we would like to hear how you would want it to work.
Start a conversation